Smart Money Zones - Multi-Timeframe AnalysisA clean and efficient smart money concepts indicator designed for traders who follow institutional order flow and price imbalances.
Core Features:
Fair Value Gaps (FVG): Automatically detects bullish and bearish imbalances where price moved too fast, leaving gaps that often get filled
Order Blocks (OB): Identifies the last bearish candle before a bullish move (and vice versa) - institutional accumulation/distribution zones
Zone Strength Rating: Each zone is classified as Very Strong, Strong, Medium, or Weak based on size relative to ATR
Multi-Timeframe Trend Panel: Real-time dashboard showing bullish/bearish trend across 7 timeframes (1m, 5m, 15m, 30m, 1H, 4H, 1D)
Smart Features:
Zones automatically extend into the future
Mitigation tracking - zones fade when 50% filled or fully violated
Optional trend filter - only shows zones aligned with the trend
Customizable zone limits to keep your chart clean
Adjustable panel position (4 corners) and size
Color-Coded Zones:
🟢 Bullish FVG (Green) - Support zones
🔴 Bearish FVG (Red) - Resistance zones
🔵 Bullish OB (Blue) - Demand zones
🟠 Bearish OB (Orange) - Supply zones
Perfect for scalpers, day traders, and swing traders who trade reversals at key institutional levels. Combines smart money concepts with multi-timeframe confirmation for higher probability setups.
ابحث في النصوص البرمجية عن "smart money"

Smart Money Alpha Signals (Performance Dashboard) Smart Money Alpha Signals: Identifying Market Leaders & Generating Alpha
GMP Alpha Signals (Global Market Performance Alpha) is a specialized analysis tool designed not merely to find stocks that are rising, but to identify "Alpha" assets—Market Leaders that defend their price or rise even under adverse conditions where the market index falls or consolidates.
This indicator visualizes the concept of Comparative Relative Strength (RS) and Smart Money accumulation patterns, helping traders capture profit opportunities even during bearish market phases.
Key Objectives (Purpose)
Alpha Capture: Identifying assets generating 'excess returns' that outperform the market Beta.
Smart Money Tracking: Detecting traces of 'institutional buying' and 'accumulation' that defend prices during index plunges.
Decoupling Identification: Spotting assets moving on independent catalysts or momentum, regardless of the broader market direction.
Stop Hunt Filtering: Distinguishing 'fake drops' where price dips temporarily, but Relative Strength remains intact.
Dashboard Guide
Interpretation of the information panel (Table) displayed on the chart.
Rel. Performance: Shows the excess return compared to the index over the set period. (Positive/Green = Stronger than the market).
Decoupling Strength: The correlation coefficient with the index. Lower values (0 or negative) indicate movement independent of market risk.
Bullish: The count/rate of rising or limiting losses when the index drops sharply (e.g., < -0.5%). (Gold = Market Crash Leader).
Defended: The count/rate of holding support levels when the index shows mild weakness (e.g., < -0.05%). (Gold = Strong Accumulation).
Bench. Defense: The defense rate of the comparison benchmark (e.g., TSLA, ETH). Your target asset must be higher to be considered the sector leader.
Input Options & Settings Guide
You can optimize settings according to your trading style and asset class (Stocks/Crypto).
(1) Main Settings
Major Index: The baseline market index for comparison.
(US Stocks: NASDAQ:NDX or TVC:SPX / Crypto: BINANCE:BTCUSDT)
Benchmark Symbol: A competitor within the sector.
(e.g., Set NVDA when analyzing Semiconductor stocks).
Correlation Lookback: The lookback period for judging decoupling. (Default: 30)
Performance Lookback: The number of bars to calculate cumulative returns and defense rates. (Default: 60)
(2) Dashboard Thresholds
These settings define the criteria for what qualifies as "Defended" or "Bullish".
Performance (Max %): Used to find assets that haven't pumped yet. Signals trigger only when Alpha is below this value.
Defended Logic:
Index Drop Condition: The index must drop by at least this amount to start checking. (e.g., -0.05%)
Asset Buffer: How much the asset must outperform the index drop.
(Example: If Index drops -1.0% and Buffer is 0.2%, the asset must be at least -0.8% to count as 'Defended').
Bullish Logic: Measures resilience during steeper market dumps (e.g., -0.5% drop) compared to the Defended Logic.
Volume Settings: Decides whether to count Defended/Bullish instances only when accompanied by volume above the SMA.
(3) Signal Logic Settings (Crucial)
Customize conditions to trigger alerts. The choice between AND / OR is crucial.
AND: Condition must be met SIMULTANEOUSLY with other active conditions (Conservative/High Certainty).
OR: Condition triggers the signal INDEPENDENTLY (Aggressive/Opportunity Capture).
Performance: Is the relative performance within the threshold? (Basic Filter).
Decoupling: Has the correlation dropped? (Start of independent move).
Bullish Rate: Is the Bullish rate high during market dumps?
Defended Rate (High): (Recommended) Is there continuous price defense occurring? (Accumulation detection).
Defended Rate (Low): (Warning) Has the defense rate broken down? (For Stop Loss).
Defended > Benchmark: Is it stronger than the Benchmark (2nd tier)?
Volume Spike: Has volume surged compared to the average? (Institutional involvement).
RSI Oversold: Is it in oversold territory? (Counter-trend trading).
Decoupling Move: Does the current bar show the "Index Down / Asset Up" pattern?
Min USD Volume: Transaction value filter (To exclude low liquidity assets).

Smart Money Toolkit - PD Engine Bias Map [KedArc Quant]Description
Smart Money is an advanced multi-layer Smart Money Concepts framework that automatically detects structure shifts, premium-discount zones, and institutional order flow.
It is built around the PD Engine, which calculates the midpoint of the most recent market swing and dynamically determines BUY or SELL bias based on where current price trades relative to that equilibrium. This toolkit visualizes structure, order blocks, and bias context in one clean map, giving traders an institutional-grade view without unnecessary signal clutter.
Why It Is Unique
- All CHoCH, BOS, Order Block, FVG, and PD logic are coded from scratch.
- Uses true equilibrium (50 percent PD midpoint) for dynamic bias.
- Optimized for stability and non-repainting behavior.
- Designed for clarity with minimal, performance-safe visuals.
Entry and Exit Logic (Discretionary Framework)
- This toolkit is not a signal generator. It provides market context that guides discretionary trading.
BUY Bias (Discount Zone)
- Price trades below PD Mid: the market is in discount.
- Wait for a bullish CHoCH or reaction from a demand OB or FVG before buying.
- Target 1 = PD Mid. Target 2 = next opposite OB or FVG.
SELL Bias (Premium Zone)
- Price trades above PD Mid: the market is in premium.
- Wait for a bearish CHoCH or reaction from a supply OB or FVG before shorting.
- Target 1 = PD Mid. Target 2 = next opposite OB or FVG.
Institutional concept sequence: Bias → Structure Shift → Confirmation → Execution.
Input Configuration
Swing Sensitivity - Determines how far back to identify HH and LL pivots.
OB / FVG Detection - Toggles visual Order Block or Fair Value Gap zones.
PD Engine - Shows PD midpoint line, zone shading, and bias table.
Multi-TF Bias Sync - Optionally reads a higher timeframe bias for confirmation.
Color Themes - Switch between light, dark, or institutional palettes.
Formula / Logic Summary
Concept Formula
PD Mid (Equilibrium) (Recent Swing High + Recent Swing Low) / 2
BUY Bias close < PD Mid
SELL Bias close > PD Mid
CHoCH / BOS Pivot-based structure reversal: HH→LL or LL→HH
Order Block Last bullish or bearish candle before displacement.
FVG Gap between prior candle high/low and next candle range.
These formulas follow the structure used in institutional Smart Money Concepts.
How It Helps Traders
- Shows institutional premium and discount zones visually.
- Defines clear directional bias before entry.
- Combines structure, order blocks, FVG, and equilibrium in one layout.
- Works on any timeframe or asset.
- Prevents emotional trades by giving objective bias context.
Glossary
PD Mid Midpoint between recent swing high and low (market fair value).
Premium Zone Price above PD Mid; sellers control.
Discount Zone Price below PD Mid; buyers control.
CHoCH Change of Character, first reversal signal.
BOS Break of Structure, trend continuation confirmation.
OB Order Block, last institutional candle before move.
FVG Fair Value Gap, price imbalance often revisited.
FAQ
Q: Is this a signal indicator?
A: No. It is a contextual framework that supports manual decision-making.
Q: Does it repaint?
A: No. All structure logic is confirmed on bar close.
Q: Does it work on all markets?
A: Yes. It is purely price-based and timeframe independent.
Q: When does bias change?
A: Only after a new confirmed swing high or low.
Q: Can it be backtested?
A: You can build strategies on top of this context using your own entry and exit rules.
Disclaimer
This script is provided for educational purposes only.
It is not financial advice.
Trading carries risk. Past performance does not guarantee future results.
Use proper risk management and test on demo accounts before applying to live markets.

Smart Money Breakouts [iskess 01-02 11:05]This is an big update to the excellent Smart Money Breakout Script published in Oct 2023 by ChartPrime who, to my knowledge, was the original author.
FULL CREDIT GOES TO CHARTPRIME FOR THIS ORIGINAL WORK.
Per the moderator's rules, you will find below a meaningful, detailed self-contained description that does not rely on delegation to the open source code or links to other content. You will find in the description details on what the script does, how it does that, how to use it, and how it is original.
The "Smart Money Breakouts" indicator is designed to identify breakouts based on changes in character (CHOCH) or breaks of structure (BOS) patterns, facilitating automated trading with user-defined Take Profit (TP) level.
The indicator incorporates essential elements such as volume analysis and a data table to assist traders in optimizing their strategies.
🔸Breakout Detection:
The indicator scans price movements for "Change in Character" (CHOCH) and "Break of Structure" (BOS) patterns, signaling potential breakout opportunities in the market.
🔸User-Defined TP/SL :
Traders can customize the Take Profit (TP) and Stop Loss (SL) through the indicator settings, with these levels dynamically calculated based on the Average True Range (ATR). This allows for precise risk management and profit targets that adapt to market volatility. Traders can also select the lookback period for the TP/SL calculations.
🔸Volume Analysis and Trade Direction Specific Analysis:
The indicator includes a volume checker that provides valuable insights into the strength of the breakout, taking into account trade direction.
🔸If the volume label is red and the trade is long, it suggests a higher likelihood of hitting the Stop Loss (SL).
🔸If the volume label is green and the trade is long, it indicates a higher probability of hitting the Take Profit (TP).
🔸For short trades, a red volume label suggests a higher likelihood of hitting TP, while a green label suggests a higher likelihood of hitting SL.
🔸A yellow volume label suggests that the volume is inconclusive, neither favoring bullish nor bearish movements.
🔸Data Table:
The indicator features a data table that keeps track of the number of winning and losing trades for specific timeframes or configurations. It also shows the percentage of profits vs losses, and the overall profit/loss for the selected lookback period.
This table serves as a valuable tool for traders to analyze performance and discover optimal settings and timeframes.
The "Smart Money Breakouts" indicator provides traders with a comprehensive solution for breakout trading, combining technical analysis of changes in character and breaks of structure, volume insights, and performance tracking while dynamically adjusting TP and SL levels based on market volatility through the ATR.
This version of the script is a "significant improvement" from Chart Prime's original work in the following ways:
- A selectable range of candles for the profit/loss calculations to look back on.
- An updated table that includes the percentage of wins/losses, and and overall P&L during the selected lookback range.
- The user can now select only Long trades, Short trades, or both.
- The percentage gain/loss is now indicated for every trade on the chart.
- The user can now select a different multiplier for Stop Loss or Take Profit thresholds.

Smart Money Concepts IndicatorBEST ICT AND SMC INDICATOR
The **Smart Money Concepts Indicator** is designed to enhance trading decisions by incorporating key principles from Smart Money Concepts (SMC), focusing on the detection of market structure changes, liquidity zones, order flow, and order blocks. This indicator is particularly useful for traders looking to understand market dynamics and make informed trading decisions based on advanced market analysis.
#### Key Features:
1. **Break of Structure (BOS)**:
- Identifies upward and downward breaks in market structure, indicating potential trend reversals.
- Visual markers on the chart help traders spot these critical levels.
2. **Change of Character (CHOCH)**:
- Detects significant changes in market direction, highlighting potential shifts in momentum.
- Clearly labeled signals indicate when the market may be changing its character.
3. **Order Blocks**:
- Highlights order blocks, which are key areas where significant buying or selling has occurred.
- Provides visual cues for potential support and resistance zones.
4. **Liquidity Zones**:
- Marks liquidity zones, indicating areas where buy-side or sell-side liquidity may be targeted.
- Helps traders understand where the market might draw liquidity.
5. **Dynamic Take Profit and Stop Loss Levels**:
- Calculates and plots take profit (TP) and stop loss (SL) levels based on the Average True Range (ATR) for adaptive risk management.
- Customizable multipliers allow traders to adjust levels based on their risk tolerance.
6. **Order Flow Analysis**:
- Displays bullish and bearish order flow signals based on candle close relative to open.
- Provides insights into market sentiment and potential future price action.
#### How to Use:
- **Identifying Entry and Exit Points**: Use BOS and CHOCH signals to find potential entry points, while leveraging TP and SL levels for risk management.
- **Market Analysis**: Analyze order blocks and liquidity zones to make informed decisions on market behavior.
- **Visual Confirmation**: The clear visual cues provided by the indicator make it easier to interpret market movements and align trades with institutional behavior.
#### Conclusion:
The Smart Money Concepts Indicator is an invaluable tool for traders looking to enhance their understanding of market structure and make more informed trading decisions. By integrating advanced concepts like BOS, CHOCH, and liquidity analysis, this indicator helps traders navigate the complexities of the market with greater confidence.

Smart Money Concepts by WeloTradesThe "Smart Money Concepts by WeloTrades" indicator is designed to offer traders a comprehensive tool that integrates multiple advanced features to aid in market analysis. By combining order blocks, liquidity levels, fair value gaps, trendlines, and market structure analysis, the indicator provides a holistic approach to understanding market dynamics and making informed trading decisions.
Components and Their Integration:
Order Blocks and Breaker Blocks Detection
Functionality: Order blocks represent areas where significant buying or selling occurred, creating potential support or resistance zones. Breaker blocks signal potential reversals.
Integration: By detecting and visualizing these blocks, the indicator helps traders identify key levels where price might react, aiding in entry and exit decisions. The customizable settings allow traders to adjust the visibility and parameters to suit their specific trading strategy.
Liquidity Levels Analysis
Functionality: Liquidity levels indicate zones where significant price movements can occur due to the presence of large orders. These are areas where smart money might be executing trades.
Integration: By tracking these high-probability liquidity areas, traders can anticipate potential price movements. Customizable display limits and mitigation strategies ensure that the information is tailored to the trader’s needs, providing precise and actionable insights.
Fair Value Gaps (FVG)
Functionality: Fair value gaps highlight areas where there is an imbalance between buyers and sellers. These gaps often represent potential trading opportunities.
Integration: The ability to identify and analyze FVGs helps traders spot potential entries based on market inefficiencies. The touch and break detection functionalities provide further refinement, enhancing the precision of trading signals.
Trendlines
Functionality: Trendlines help in identifying the direction of the market and potential reversal points. The additional trendline adds a layer of confirmation for breaks or retests.
Integration: Automatically drawn trendlines assist traders in visualizing market trends and making decisions about potential entries and exits. The additional trendline for stronger confirmation reduces the risk of false signals, providing more reliable trading opportunities.
Market Structure Analysis
Functionality: Understanding market structure is crucial for identifying key support and resistance levels and overall market dynamics. This component displays internal, external, and composite market structures.
Integration: By automatically highlighting shifts in market structure, the indicator helps traders recognize important levels and potential changes in market direction. This analysis is critical for strategic planning and execution in trading.
Customizable Alerts
Functionality: Alerts ensure that traders do not miss significant market events, such as the formation or breach of order blocks, liquidity levels, and trendline interactions.
Integration: Customizable alerts enhance the user experience by providing timely notifications of key events. This feature ensures that traders can act quickly and efficiently, leveraging the insights provided by the indicator.
Interactive Visualization
Functionality: Customizable visual aspects of the indicator allow traders to tailor the display to their preferences and trading style.
Integration: This feature enhances user engagement and usability, making it easier for traders to interpret the data and make informed decisions. Personalization options like colors, styles, and display formats improve the overall effectiveness of the indicator.
How Components Work Together
Comprehensive Market Analysis
Each component of the indicator addresses a different aspect of market analysis. Order blocks and liquidity levels highlight potential support and resistance zones, while fair value gaps and trendlines provide additional context for potential entries and exits. Market structure analysis ties everything together by offering a broad view of market dynamics.
Synergistic Insights
The integration of multiple features allows for cross-validation of trading signals. For instance, an order block coinciding with a high-probability liquidity level and a fair value gap can provide a stronger signal than any of these features alone. This synergy enhances the reliability of the insights and trading signals generated by the indicator.
Enhanced Decision Making
By combining these advanced features into a single tool, traders are equipped with a powerful resource for making informed decisions. The customizable alerts and interactive visualization further support this by ensuring that traders can act quickly on the insights provided.
Order Blocks ( OB) & Breaker Blocks (BB) Visuals:
📝 OB Input Settings
📊 Timeframe #1
TF #1🕑: Enable or disable Timeframe 1.
What it is: A boolean input to toggle the use of the first timeframe.
What it does: Enables or disables Timeframe 1 for the OB settings.
How to use it: Check or uncheck the box to enable or disable.
📊 Timeframe 1 Selection
Timeframe #1🕑: Select the timeframe for Timeframe 1.
What it is: A dropdown to select the desired timeframe.
What it does: Sets the timeframe for Timeframe 1.
How to use it: Choose a timeframe from the dropdown list.
📊 Timeframe #2
TF #2🕑: Enable or disable Timeframe 2.
What it is: A boolean input to toggle the use of the second timeframe.
What it does: Enables or disables Timeframe 2 for the OB settings.
How to use it: Check or uncheck the box to enable or disable.
📊 Timeframe 2 Selection
Timeframe #2🕑: Select the timeframe for Timeframe 2.
What it is: A dropdown to select the desired timeframe.
What it does: Sets the timeframe for Timeframe 2.
How to use it: Choose a timeframe from the dropdown list.
Additional Info: Higher TF Chart & Lower TF Setting / Lower TF Chart & Higher TF Setting.
📏 Show OBs
OB (Length)📏: Toggle the display of Order Blocks.
What it is: A boolean input to enable or disable the display of Order Blocks.
What it does: Shows or hides Order Blocks based on the selected swing length.
How to use it: Check or uncheck the box to enable or disable.
📏 Swing Length Option
Swing Length Option: Select the swing length option.
What it is: A dropdown to choose between SHORT, MID, LONG, or CUSTOM.
What it does: Sets the length of swings for Order Blocks.
How to use it: Choose an option from the dropdown.
Additional Info: Default lengths are SHORT=10, MID=28, LONG=50.
🔧 Custom Swing Length
🔧custom: Specify a custom swing length.
What it is: An integer input for setting a custom swing length.
What it does: Overrides the default swing lengths if set to CUSTOM.
How to use it: Enter a custom integer value (only shown when CUSTOM is selected).
📛 Show BBs
BB (Method)📛: Toggle the display of Breaker Blocks.
What it is: A boolean input to enable or disable the display of Breaker Blocks.
What it does: Shows or hides Breaker Blocks.
How to use it: Check or uncheck the box to enable or disable.
📛 OB End Method
OB End Method: Select the method for determining the end of a Breaker Block.
What it is: A dropdown to choose between Wick and Close.
What it does: Sets the criteria for when a Breaker Block is considered mitigated.
How to use it: Choose an option from the dropdown.
Additional Info: Wicks: OB is mitigated when the price wicks through the OB Level. Close: OB is mitigated when the closing price is within the OB Level.
🔍 Max Bullish Zones
🔍Max Bullish: Set the maximum number of Bullish Order Blocks to display.
What it is: A dropdown to select the maximum number of Bullish Order Blocks.
What it does: Limits the number of Bullish Order Blocks shown on the chart.
How to use it: Choose a value from the dropdown (1-10).
🔍 Max Bearish Zones
🔍Max Bearish: Set the maximum number of Bearish Order Blocks to display.
What it is: A dropdown to select the maximum number of Bearish Order Blocks.
What it does: Limits the number of Bearish Order Blocks shown on the chart.
How to use it: Choose a value from the dropdown (1-10).
🟩 Bullish OB Color
Bullish OB Color: Set the color for Bullish Order Blocks.
What it is: A color picker to set the color of Bullish Order Blocks.
What it does: Changes the color of Bullish Order Blocks on the chart.
How to use it: Select a color from the color picker.
🟥 Bearish OB Color
Bearish OB Color: Set the color for Bearish Order Blocks.
What it is: A color picker to set the color of Bearish Order Blocks.
What it does: Changes the color of Bearish Order Blocks on the chart.
How to use it: Select a color from the color picker.
🔧 OB & BB Range
↔ OB & BB Range: Select the range option for OB and BB.
What it is: A dropdown to choose between RANGE and CUSTOM.
What it does: Sets how far the OB or BB should extend.
How to use it: Choose an option from the dropdown.
Additional Info: RANGE = Current price, CUSTOM = Adjustable Range.
🔧 Custom OB & BB Range
🔧Custom: Specify a custom range for OB and BB.
What it is: An integer input for setting a custom range.
What it does: Defines how far the OB or BB should go, based on a custom value.
How to use it: Enter a custom integer value (range: 1000-500000).
💬 Text Options
💬Text Options: Set text size and color for OB and BB.
What it is: A dropdown to select text size and a color picker to choose text color.
What it does: Changes the size and color of the text displayed for OB and BB.
How to use it: Select a size from the dropdown and a color from the color picker.
💬 Show Timeframe OB
Text: Toggle to display the timeframe of OB.
What it is: A boolean input to show or hide the timeframe text for OB.
What it does: Displays the timeframe information for Order Blocks on the chart.
How to use it: Check or uncheck the box to enable or disable.
💬 Show Volume
Volume: Toggle to display the volume of OB.
What it is: A boolean input to show or hide the volume information for Order Blocks.
What it does: Displays the volume information for Order Blocks on the chart.
How to use it: Check or uncheck the box to enable or disable.
Additional Info:
What it represents: The volume displayed represents the total trading volume that occurred during the formation of the Order Block. This can indicate the level of participation or interest in that price level.
How it's calculated: The volume is the sum of all traded volumes within the candles that form the Order Block.
What it means: Higher volume at an Order Block level may suggest stronger support or resistance. It shows the amount of trading activity and can be an indicator of the potential strength or validity of the Order Block.
Why it's shown: To give traders an idea of the market participation and to help assess the strength of the Order Block.
💬 Show Percentage
%: Toggle to display the percentage of OB.
What it is: A boolean input to show or hide the percentage information for Order Blocks.
What it does: Displays the percentage information for Order Blocks on the chart.
How to use it: Check or uncheck the box to enable or disable.
Additional Info:
What it represents: The percentage displayed usually represents the proportion of price movement relative to the Order Block.
How it's calculated: This can be the percentage move from the start to the end of the Order Block or the retracement level that price has reached relative to the Order Block's range.
What it means: It helps traders understand the extent of price movement within the Order Block and can indicate the significance of the price level.
Why it's shown: To provide a clearer understanding of the price dynamics and the importance of the Order Block within the overall price movement.
Additional Information
Volume Example: If an Order Block forms over three candles with volumes of 100, 150, and 200, the total volume displayed for that Order Block would be 450.
Percentage Example: If the price moves from 100 to 110 within an Order Block, and the total range of the Order Block is from 100 to 120, the percentage shown might be 50% (since the price has moved halfway through the Order Block's range).
Liquidity Levels visuals:
📊 Liquidity Levels Input Settings
📊 Current Timeframe
TF #1🕑: Enable or disable the current timeframe.
What it is: A boolean input to toggle the use of the current timeframe.
What it does: Enables or disables the display of liquidity levels for the current timeframe.
How to use it: Check or uncheck the box to enable or disable.
📊 Higher Timeframe
Higher Timeframe: Select the higher timeframe for liquidity levels.
What it is: A dropdown to select the desired higher timeframe.
What it does: Sets the higher timeframe for liquidity levels.
How to use it: Choose a timeframe from the dropdown list.
📏 Liquidity Length Option
📏Liquidity Length: Select the length for liquidity levels.
What it is: A dropdown to choose between SHORT, MID, LONG, or CUSTOM.
What it does: Sets the length of swings for liquidity levels.
How to use it: Choose an option from the dropdown.
Additional Info: Default lengths are SHORT=10, MID=28, LONG=50.
🔧 Custom Liquidity Length
🔧custom: Specify a custom length for liquidity levels.
What it is: An integer input for setting a custom swing length.
What it does: Overrides the default liquidity lengths if set to CUSTOM.
How to use it: Enter a custom integer value (only shown when CUSTOM is selected).
📛 Mitigation Method
📛Mitigation (Method): Select the method for determining the mitigation of liquidity levels.
What it is: A dropdown to choose between Close and Wick.
What it does: Sets the criteria for when a liquidity level is considered mitigated.
How to use it: Choose an option from the dropdown.
Additional Info:
Wick: Level is mitigated when the price wicks through the level.
Close: Level is mitigated when the closing price is within the level.
📛 Display Mitigated Levels
-: Select to display or hide mitigated levels.
What it is: A dropdown to choose between Remove and Show.
What it does: Displays or hides mitigated liquidity levels.
How to use it: Choose an option from the dropdown.
Additional Info:
Remove: Hide mitigated levels.
Show: Display mitigated levels.
🔍 Max Buy Side Liquidity
🔍Max Buy Side Liquidity: Set the maximum number of Buy Side Liquidity Levels to display.
What it is: An integer input to set the maximum number of Buy Side Liquidity Levels.
What it does: Limits the number of Buy Side Liquidity Levels shown on the chart.
How to use it: Enter a value between 0 and 50.
🟦 Buy Side Liquidity Color
Buy Side Liquidity Color: Set the color for Buy Side Liquidity Levels.
What it is: A color picker to set the color of Buy Side Liquidity Levels.
What it does: Changes the color of Buy Side Liquidity Levels on the chart.
How to use it: Select a color from the color picker.
Additional Info:
Tooltip: Set the maximum number of Buy Side Liquidity Levels to display. Default: 5, Min: 1, Max: 50.
If liquidity levels are not displayed as expected, try increasing the max count.
🔍 Max Sell Side Liquidity
🔍Max Sell Side Liquidity: Set the maximum number of Sell Side Liquidity Levels to display.
What it is: An integer input to set the maximum number of Sell Side Liquidity Levels.
What it does: Limits the number of Sell Side Liquidity Levels shown on the chart.
How to use it: Enter a value between 0 and 50.
🟥 Sell Side Liquidity Color
Sell Side Liquidity Color: Set the color for Sell Side Liquidity Levels.
What it is: A color picker to set the color of Sell Side Liquidity Levels.
What it does: Changes the color of Sell Side Liquidity Levels on the chart.
How to use it: Select a color from the color picker.
Additional Info:
Tooltip: Set the maximum number of Sell Side Liquidity Levels to display. Default: 5, Min: 1, Max: 50.
If liquidity levels are not displayed as expected, try increasing the max count.
✂ Box Style (Height)
✂ Box Style (↕): Set the box height style for liquidity levels.
What it is: A float input to set the height of the boxes.
What it does: Adjusts the height of the boxes displaying liquidity levels.
How to use it: Enter a value between -50 and 50.
Additional Info: Default value is -5.
📏 Box Length
b: Set the box length of liquidity levels.
What it is: An integer input to set the length of the boxes.
What it does: Adjusts the length of the boxes displaying liquidity levels.
How to use it: Enter a value between 0 and 500.
Additional Info: Default value is 20.
⏭ Extend Liquidity Levels
Extend ⏭: Toggle to extend liquidity levels beyond the current range.
What it is: A boolean input to enable or disable the extension of liquidity levels.
What it does: Extends liquidity levels beyond their default range.
How to use it: Check or uncheck the box to enable or disable.
Additional Info: Extend liquidity levels beyond the current range.
💬 Text Options
💬 Text Options: Set text size and color for liquidity levels.
What it is: A dropdown to select text size and a color picker to choose text color.
What it does: Changes the size and color of the text displayed for liquidity levels.
How to use it: Select a size from the dropdown and a color from the color picker.
💬 Show Text
Text: Toggle to display text for liquidity levels.
What it is: A boolean input to show or hide the text for liquidity levels.
What it does: Displays the text information for liquidity levels on the chart.
How to use it: Check or uncheck the box to enable or disable.
💬 Show Volume
Volume: Toggle to display the volume of liquidity levels.
What it is: A boolean input to show or hide the volume information for liquidity levels.
What it does: Displays the volume information for liquidity levels on the chart.
How to use it: Check or uncheck the box to enable or disable.
Additional Info:
What it represents: The volume displayed represents the total trading volume that occurred during the formation of the liquidity level. This can indicate the level of participation or interest in that price level.
How it's calculated: The volume is the sum of all traded volumes within the candles that form the liquidity level.
What it means: Higher volume at a liquidity level may suggest stronger support or resistance. It shows the amount of trading activity and can be an indicator of the potential strength or validity of the liquidity level.
Why it's shown: To give traders an idea of the market participation and to help assess the strength of the liquidity level.
💬 Show Percentage
%: Toggle to display the percentage of liquidity levels.
What it is: A boolean input to show or hide the percentage information for liquidity levels.
What it does: Displays the percentage information for liquidity levels on the chart.
How to use it: Check or uncheck the box to enable or disable.
Additional Info:
What it represents: The percentage displayed usually represents the proportion of price movement relative to the liquidity level.
How it's calculated: This can be the percentage move from the start to the end of the liquidity level or the retracement level that price has reached relative to the liquidity level's range.
What it means: It helps traders understand the extent of price movement within the liquidity level and can indicate the significance of the price level.
Why it's shown: To provide a clearer understanding of the price dynamics and the importance of the liquidity level within the overall price movement.
Fair Value Gaps visuals:
📊 Fair Value Gaps Input Settings
📊 Show FVG
TF #1🕑: Enable or disable Fair Value Gaps for Timeframe 1.
What it is: A boolean input to toggle the display of Fair Value Gaps.
What it does: Shows or hides Fair Value Gaps on the chart.
How to use it: Check or uncheck the box to enable or disable.
📊 Select Timeframe
Timeframe: Select the timeframe for Fair Value Gaps.
What it is: A dropdown to select the desired timeframe.
What it does: Sets the timeframe for Fair Value Gaps.
How to use it: Choose a timeframe from the dropdown list.
Additional Info: Higher TF Chart & Lower TF Setting or Lower TF Chart & Higher TF Setting.
📛 FVG Break Method
📛FVG Break (Method): Select the method for determining when an FVG is mitigated.
What it is: A dropdown to choose between Touch, Wicks, Close, or Average.
What it does: Sets the criteria for when a Fair Value Gap is considered mitigated.
How to use it: Choose an option from the dropdown.
Additional Info:
Touch: FVG is mitigated when the price touches the gap.
Wicks: FVG is mitigated when the price wicks through the gap.
Close: FVG is mitigated when the closing price is within the gap.
Average: FVG is mitigated when the average price (average of high and low) is within the gap.
📛 Show Mitigated FVG
show: Toggle to display mitigated FVGs.
What it is: A boolean input to show or hide mitigated Fair Value Gaps.
What it does: Displays or hides mitigated Fair Value Gaps.
How to use it: Check or uncheck the box to enable or disable.
📛 Fill FVG
Fill: Toggle to fill Fair Value Gaps.
What it is: A boolean input to fill the Fair Value Gaps with color.
What it does: Adds a color fill to the Fair Value Gaps.
How to use it: Check or uncheck the box to enable or disable.
📛 Shade FVG
Shade: Toggle to shade Fair Value Gaps.
What it is: A boolean input to shade the Fair Value Gaps.
What it does: Adds a shade effect to the Fair Value Gaps.
How to use it: Check or uncheck the box to enable or disable.
Additional Info: Select the method to break FVGs and toggle the visibility of FVG Breaks (fill FVG and/or shade FVG).
🔍 Max Bullish FVG
🔍Max Bullish FVG: Set the maximum number of Bullish Fair Value Gaps to display.
What it is: An integer input to set the maximum number of Bullish Fair Value Gaps.
What it does: Limits the number of Bullish Fair Value Gaps shown on the chart.
How to use it: Enter a value between 0 and 50.
🔍 Max Bearish FVG
🔍Max Bearish FVG: Set the maximum number of Bearish Fair Value Gaps to display.
What it is: An integer input to set the maximum number of Bearish Fair Value Gaps.
What it does: Limits the number of Bearish Fair Value Gaps shown on the chart.
How to use it: Enter a value between 0 and 50.
🟥 Bearish FVG Color
Bearish FVG Color: Set the color for Bearish Fair Value Gaps.
What it is: A color picker to set the color of Bearish Fair Value Gaps.
What it does: Changes the color of Bearish Fair Value Gaps on the chart.
How to use it: Select a color from the color picker.
Additional Info:
Tooltip: Set the maximum number of Bearish Fair Value Gaps to display. Default: 5, Min: 1, Max: 50.
If Fair Value Gaps are not displayed as expected, try increasing the max count.
🟦 Bullish FVG Color
Bullish FVG Color: Set the color for Bullish Fair Value Gaps.
What it is: A color picker to set the color of Bullish Fair Value Gaps.
What it does: Changes the color of Bullish Fair Value Gaps on the chart.
How to use it: Select a color from the color picker.
Additional Info:
Tooltip: Set the maximum number of Bullish Fair Value Gaps to display. Default: 5, Min: 1, Max: 50.
If Fair Value Gaps are not displayed as expected, try increasing the max count.
📏 FVG Range
↔ FVG Range: Set the range for Fair Value Gaps.
What it is: An integer input to set the range of the Fair Value Gaps.
What it does: Adjusts the range of the Fair Value Gaps displayed.
How to use it: Enter a value between 0 and 100.
Additional Info: Adjustable length only works when both RANGE & EXTEND display OFF. Range=current price, Extend=Full Range.
⏭ Extend FVG
Extend⏭: Toggle to extend Fair Value Gaps beyond the current range.
What it is: A boolean input to enable or disable the extension of Fair Value Gaps.
What it does: Extends Fair Value Gaps beyond their default range.
How to use it: Check or uncheck the box to enable or disable.
⏯ FVG Range
Range⏯: Toggle the range of Fair Value Gaps.
What it is: A boolean input to enable or disable the range display for Fair Value Gaps.
What it does: Sets the range of Fair Value Gaps displayed.
How to use it: Check or uncheck the box to enable or disable.
↕ Max Width
↕ Max Width: Set the maximum width of Fair Value Gaps.
What it is: A float input to set the maximum width of Fair Value Gaps.
What it does: Limits the width of Fair Value Gaps as a percentage of the price range.
How to use it: Enter a value between 0 and 5.0.
Additional Info: FVGs wider than this value will be ignored.
♻ Filter FVG
Filter FVG ♻: Toggle to filter out small Fair Value Gaps.
What it is: A boolean input to filter out small Fair Value Gaps.
What it does: Ignores Fair Value Gaps smaller than the specified max width.
How to use it: Check or uncheck the box to enable or disable.
➖ Mid Line Style
➖Mid Line Style: Select the style of the mid line for Fair Value Gaps.
What it is: A dropdown to choose between Solid, Dashed, or Dotted.
What it does: Sets the style of the mid line within Fair Value Gaps.
How to use it: Choose an option from the dropdown.
🎨 Mid Line Color
Mid Line Color: Set the color for the mid line within Fair Value Gaps.
What it is: A color picker to set the color of the mid line.
What it does: Changes the color of the mid line within Fair Value Gaps.
How to use it: Select a color from the color picker.
Additional Information
Mitigation Methods: Each method (Touch, Wicks, Close, Average) provides different criteria for when a Fair Value Gap is considered mitigated, helping traders to understand the dynamics of price movements within gaps.
Volume and Percentage: Displaying volume and percentage information for Fair Value Gaps helps traders gauge the strength and significance of these gaps in relation to trading activity and price movements.
Trendlines visuals:
📊 Trendlines Input Settings
📊 Show Trendlines
Trendlines & Trendlines Difference(%) ↕: Enable or disable trendlines and set the percentage difference from the first trendline.
What it is: A boolean input to toggle the display of trendlines.
What it does: Shows or hides trendlines on the chart and allows setting a percentage difference from the first trendline.
How to use it: Check or uncheck the box to enable or disable.
Additional Info: The percentage difference determines the distance of the second trendline from the first one.
📏 Trendline Length Option
📏Trendline Length: Select the length for trendlines.
What it is: A dropdown to choose between SHORT, MID, LONG, or CUSTOM.
What it does: Sets the length of trendlines.
How to use it: Choose an option from the dropdown.
Additional Info: Default lengths are SHORT=50, MID=100, LONG=200.
🔧 Custom Trendline Length
🔧custom: Specify a custom length for trendlines.
What it is: An integer input for setting a custom trendline length.
What it does: Overrides the default trendline lengths if set to CUSTOM.
How to use it: Enter a custom integer value (only shown when CUSTOM is selected).
🔍 Max Bearish Trendlines
🔍Max Trendlines Bearish: Set the maximum number of bearish trendlines to display.
What it is: A dropdown to select the maximum number of bearish trendlines.
What it does: Limits the number of bearish trendlines shown on the chart.
How to use it: Choose a value from the dropdown (2-20).
🟩 Bearish Trendline Color
Bearish Trendline Color: Set the color for bearish trendlines.
What it is: A color picker to set the color of bearish trendlines.
What it does: Changes the color of bearish trendlines on the chart.
How to use it: Select a color from the color picker.
Additional Info: Adjust to control how many bearish trendlines are displayed.
🔍 Max Bullish Trendlines
🔍Max Trendlines Bullish: Set the maximum number of bullish trendlines to display.
What it is: A dropdown to select the maximum number of bullish trendlines.
What it does: Limits the number of bullish trendlines shown on the chart.
How to use it: Choose a value from the dropdown (2-20).
🟥 Bullish Trendline Color
Bullish Trendline Color: Set the color for bullish trendlines.
What it is: A color picker to set the color of bullish trendlines.
What it does: Changes the color of bullish trendlines on the chart.
How to use it: Select a color from the color picker.
Additional Info: Adjust to control how many bullish trendlines are displayed.
📐 Degrees Text
📐Degrees ° (💬 Size): Enable or disable degrees text and set its size and color.
What it is: A boolean input to show or hide the degrees text for trendlines.
What it does: Displays the degrees text for trendlines.
How to use it: Check or uncheck the box to enable or disable.
📏 Text Size for Degrees
Text Size: Set the text size for degrees on trendlines.
What it is: A dropdown to select the size of the degrees text.
What it does: Changes the size of the degrees text displayed for trendlines.
How to use it: Choose a size from the dropdown (XS, S, M, L, XL).
🎨 Degrees Text Color
Degrees Text Color: Set the color for the degrees text on trendlines.
What it is: A color picker to set the color of the degrees text.
What it does: Changes the color of the degrees text on the chart.
How to use it: Select a color from the color picker.
♻ Filter Degrees
♻ Filter Degrees °: Enable or disable angle filtering and set the angle range.
What it is: A boolean input to filter trendlines by their angle.
What it does: Shows only trendlines within a specified angle range.
How to use it: Check or uncheck the box to enable or disable.
Additional Info: Angles outside this range will be filtered out.
🔢 Angle Range
Angle Range: Set the angle range for filtering trendlines.
What it is: Two float inputs to set the minimum and maximum angle for trendlines.
What it does: Defines the range of angles for which trendlines will be shown.
How to use it: Enter values for the minimum and maximum angles.
➖ Line Style
➖Style #1 & #2: Select the style of the primary and secondary trendlines.
What it is: Two dropdowns to choose between Solid, Dashed, or Dotted for the trendlines.
What it does: Sets the style of the primary and secondary trendlines.
How to use it: Choose a style from each dropdown.
📏 Line Thickness
: Set the thickness for the trendlines.
What it is: An integer input to set the thickness of the trendlines.
What it does: Adjusts the thickness of the trendlines displayed on the chart.
How to use it: Enter a value between 1 and 5.
Additional Information
Trendline Percentage Difference: Setting a percentage difference helps in analyzing the relative position and angle of trendlines.
Filtering by Angle: This feature allows focusing on trendlines within a specific angle range, enhancing the clarity of trend analysis.
BOS & CHOCH Market Structure visuals:
📊 BOS & CHOCH Market Structure Input Settings
📏 Market Structure Length Option
📏Market Structure: Select the market structure length option.
What it is: A dropdown to choose between INTERNAL, EXTERNAL, ALL, CUSTOM, or NONE.
What it does: Sets the type of market structure to be displayed.
How to use it: Choose an option from the dropdown.
Additional Info:
INTERNAL: Only internal structure.
EXTERNAL: Only external structure.
ALL: Both internal and external structures.
CUSTOM: Custom lengths.
NONE: No structure.
🔧 Custom Internal Length
🔧Custom Internal: Specify a custom length for internal market structure.
What it is: An integer input for setting a custom internal length.
What it does: Defines the length of internal market structures if CUSTOM is selected.
How to use it: Enter a custom integer value (only shown when CUSTOM is selected).
💬 Internal Label Size
💬Internal Label Size: Set the label size for internal market structures.
What it is: A dropdown to select the size of the labels.
What it does: Changes the size of the labels for internal market structures.
How to use it: Choose a size from the dropdown (XS, S, M, L, XL).
🟩 Internal Bullish Color
Internal Bullish Color: Set the color for bullish internal market structures.
What it is: A color picker to set the color of bullish internal market structures.
What it does: Changes the color of bullish internal market structures on the chart.
How to use it: Select a color from the color picker.
🟥 Internal Bearish Color
Internal Bearish Color: Set the color for bearish internal market structures.
What it is: A color picker to set the color of bearish internal market structures.
What it does: Changes the color of bearish internal market structures on the chart.
How to use it: Select a color from the color picker.
🔧 Custom External Length
🔧Custom External: Specify a custom length for external market structure.
What it is: An integer input for setting a custom external length.
What it does: Defines the length of external market structures if CUSTOM is selected.
How to use it: Enter a custom integer value (only shown when CUSTOM is selected).
💬 External Label Size
💬External Label Size: Set the label size for external market structures.
What it is: A dropdown to select the size of the labels.
What it does: Changes the size of the labels for external market structures.
How to use it: Choose a size from the dropdown (XS, S, M, L, XL).
🟩 External Bullish Color
External Bullish Color: Set the color for bullish external market structures.
What it is: A color picker to set the color of bullish external market structures.
What it does: Changes the color of bullish external market structures on the chart.
How to use it: Select a color from the color picker.
🟥 External Bearish Color
External Bearish Color: Set the color for bearish external market structures.
What it is: A color picker to set the color of bearish external market structures.
What it does: Changes the color of bearish external market structures on the chart.
How to use it: Select a color from the color picker.
📐 Show Equal Highs and Lows
EQL & EQH📐: Toggle visibility for equal highs and lows.
What it is: A boolean input to show or hide equal highs and lows.
What it does: Displays or hides equal highs and lows on the chart.
How to use it: Check or uncheck the box to enable or disable.
📏 Equal Highs and Lows Threshold
Equal Highs and Lows Threshold: Set the threshold for equal highs and lows.
What it is: A float input to set the threshold for equal highs and lows.
What it does: Defines the range within which highs and lows are considered equal.
How to use it: Enter a value between 0 and 10.
💬 Label Size for Equal Highs and Lows
💬Label Size for Equal Highs and Lows: Set the label size for equal highs and lows.
What it is: A dropdown to select the size of the labels.
What it does: Changes the size of the labels for equal highs and lows.
How to use it: Choose a size from the dropdown (XS, S, M, L, XL).
🟩 Bullish Color for Equal Highs and Lows
Bullish Color for Equal Highs and Lows: Set the color for bullish equal highs and lows.
What it is: A color picker to set the color of bullish equal highs and lows.
What it does: Changes the color of bullish equal highs and lows on the chart.
How to use it: Select a color from the color picker.
🟥 Bearish Color for Equal Highs and Lows
Bearish Color for Equal Highs and Lows: Set the color for bearish equal highs and lows.
What it is: A color picker to set the color of bearish equal highs and lows.
What it does: Changes the color of bearish equal highs and lows on the chart.
How to use it: Select a color from the color picker.
📏 Show Swing Points
Swing Points📏: Toggle visibility for swing points.
What it is: A boolean input to show or hide swing points.
What it does: Displays or hides swing points on the chart.
How to use it: Check or uncheck the box to enable or disable.
📏 Swing Points Length Option
Swing Points Length Option: Select the length for swing points.
What it is: A dropdown to choose between SHORT, MID, LONG, or CUSTOM.
What it does: Sets the length of swing points.
How to use it: Choose an option from the dropdown.
Additional Info: Default lengths are SHORT=10, MID=28, LONG=50.
💬 Swing Points Label Size
💬Swing Points Label Size: Set the label size for swing points.
What it is: A dropdown to select the size of the labels.
What it does: Changes the size of the labels for swing points.
How to use it: Choose a size from the dropdown (XS, S, M, L, XL).
🎨 Swing Points Color
Swing Points Color: Set the color for swing points.
What it is: A color picker to set the color of swing points.
What it does: Changes the color of swing points on the chart.
How to use it: Select a color from the color picker.
🔧 Custom Swing Points Length
🔧Custom Swings: Specify a custom length for swing points.
What it is: An integer input for setting a custom length for swing points.
What it does: Defines the length of swing points if CUSTOM is selected.
How to use it: Enter a custom integer value (only shown when CUSTOM is selected).
Additional Information
Market Structure Types: Understanding internal and external structures helps in analyzing different market behaviors.
Equal Highs and Lows: This feature identifies areas where price action is balanced, which can be significant for trading strategies.
Swing Points: Highlighting swing points aids in recognizing significant market reversals or continuations.
Benefits
Enhance your trading strategy by visualizing smart money's influence on price movements.
Make informed decisions with real-time data on significant market structures.
Reduce manual analysis with automated detection of key trading signals.
Ideal For
Traders looking for an edge in forex, equities, and cryptocurrency markets by understanding the underlying forces driving market dynamics.
Acknowledgements
Special thanks to these amazing creators for inspiration and their creations:
I want to thank these amazing creators for creating there amazing indicators , that inspired me and also gave me a head start by making this indicator! Without their amazing indicators it wouldn't be possible!
Flux Charts: Volumized Order Blocks
LuxAlgo: Trend Lines
UAlgo: Fair Value Gaps (FVG)
By Leviathan: Market Structure
Sonarlab: Liquidity Levels
Note
Remember to always backtest the indicator first before integrating it into your strategy! For any questions about the indicator, please feel free to ask for assistance.

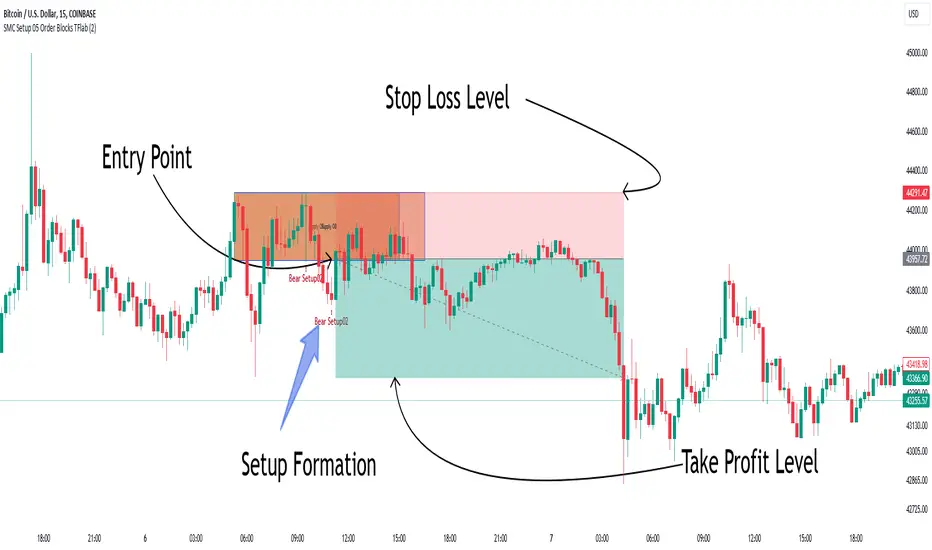
Smart Money Setup 05 [TradingFinder] Minor OB & Trend Proof🔵 Introduction
The "Smart Money Concept" transcends the realm of mere technical trading strategies to embody a comprehensive philosophy on the dynamics of market operations. It posits that key market participants engage in price manipulation, thereby complicating the trading landscape for smaller, retail traders.
Under this doctrine, retail traders are advised to tailor their strategies in alignment with the maneuvers of "Smart Money" - essentially, the capital operated by market makers.
To this end, one should endeavor to mirror the trading patterns of these influential market participants, who are adept at navigating through the nuances of supply, demand, and overall market structure. As a proponent of Smart Money trading, these elements are pivotal in your decision-making process for trade entries.
🟣 Key Insights
The core principle of this strategy hinges on misleading other traders. A sudden market movement against the prevailing trend that results in the formation of either a lower low or a higher high, followed by a pullback where a divergence pattern emerges, sets the stage.
Subsequently, the market may form another lower low or higher high. Traders, persuaded that the market will continue along the trajectory of the new movement, are caught off-guard when the price abruptly reverses direction. Following a "Stop Hunt" of the traders' open positions, the market resumes its initial trend.
To grasp the essence of this setup, observe the following illustrations.
"Bullish Setup" :
"Bearish Setup" :
🔵 How to Use
The setups can be customized based on the desired formation period. This adjustment can be made through the indicator's price setting options, where the default period is set at 2.
Upon configuring your preferred period, the signals become actionable. Once a setup forms, the subsequent step involves waiting for the price to reach the "Order Block".
"Bullish Setup" :
"Bearish Setup" :
Smart Money Setup 01 [TradingFinder]Double Order Blocks Proof🔵 Introduction
The Price Action, styled as the "Smart Money Concept" or "SMC," was introduced by Mr. David J. Crouch in 2000 and is one of the most modern technical styles in the financial world. In financial markets, Smart Money refers to capital controlled by major market players (central banks, funds, etc.), and these traders can accurately predict market trends and achieve the highest profits.
In the "Smart Money" style, various types of "order blocks" can be traded. This indicator uses a type of "order block" originating from "BoS" (Breakout of Structure). The most important feature of this indicator is the confirmation of two order blocks.
🟣 Important
For example, after the first "BoS" and the formation of the first Order Block, if a second "BoS" occurs before touching the price of the first Order Block and the formation of the second Order Block, a trading setup with 2 order blocks is formed, which confirms the dominant market trend.
For a better understanding of this subject, see the explanations in the following two images.
Bullish Setup Details :
Bearish Setup Details :
🔵 How to Use
After adding the indicator to the chart, you should wait for the formation of the trading setup. You can observe different trading positions by changing the "Time Frame" and "Pivot Period." Generally, the higher the "Time Frame" and "Pivot Period," the more valid the formed setup is.
Bullish Setup Details on Chart :
Bearish Setup Details on Chart :
You can access the "Pivot Period" input through the settings.

Smart Money Oscillator [ChartPrime]The "Smart Money Oscillator " is a premium and discount zone oscillator with BOS and CHoCH built in for further analysis of price action. This indicator works by first determining the the premium and discount zones by using pivot points and high/lows. The top of this oscillator represents the current premium zone while the bottom half of this oscillator represents the discount zone. This oscillator functionally works like a stochastic oscillator with more sophisticated upper and lower bounds generated using smart money concept theories. We have included a moving average to allow the user to visualize the currant momentum in the oscillator. Another key feature we have included lagging divergences to help traders visualize potential reversal conditions.
Understanding the concepts of Premium and Discount zones, as well as Break of Structure (BoS) and Change of Character (CHoCH), is crucial for traders using the Smart Money Oscillator. These concepts are rooted in market structure analysis, which involves studying price levels and movements.
Premium Zone is where the price is considered to be relatively high or 'overbought'. In this zone, prices have risen significantly and may indicate that the asset is becoming overvalued, potentially leading to a reversal or slowdown in the upward trend.
The Discount Zone represents a 'discount' or 'oversold' area. Here, prices have fallen substantially, suggesting that the asset might be undervalued. This could be an indicator of a potential upward reversal or a pause in the downward trend.
Break of Structure (BoS) is about the continuation of a trend. In a bullish trend, a BoS is identified by the break of a recent higher high. In a bearish trend, it's the break of a recent Lower Low. BoS indicates that the trend is strong and likely to continue in its current direction. It's a sign of strength in the prevailing trend, whether up or down.
Change of Character (CHoCH) is an indication of a potential end to a trend. It occurs when there's a significant change in the market's behavior, contradicting the current trend. For example, in an uptrend characterized by higher highs and higher lows, a CHoCH may occur if a new high is formed but then is followed by an impulsive move downwards. This suggests that the bullish trend may be weakening and a bearish reversal could be imminent. CHoCH is essentially a sign of trend exhaustion and potential reversal.
With each consecutive BoS, the signal line of the oscillator will deepen in color. This allows you to visually see the strength of the current trend. The maximum strength of the trend is found by keeping track of the maximum number of consecutive BoS's within a window of 10. This calculation excludes periods without any BoS's to allow for a more stable max.
Quick Update is a feature that implements a more aggressive algorithm to update the highs and lows. Instead of updating the pivot points exclusively to update the range levels, it will attempt to use the current historical highs/lows to update the bounds. This results in a more responsive range at the cost of stability. There are pros and cons for both settings. With Quick Update disabled, the indicator will allow for strong reversals to register without the indicator maxing out. With Quick Update enabled, the indicator will show shorter term extremes with the risk of the signal being pinned to the extremities during strong trends or large movements. With Quick Update disabled, the oscillator prioritizes stability, using a more historical perspective to set its bounds. When Quick Update is enabled, the oscillator becomes more responsive, adjusting its bounds rapidly to reflect the latest market movements.
The Scale Offset feature allows the indicator to break the boundaries of the oscillator. This can be useful when the market is breaking highs or lows allowing the user to identify extremities in price. With Scale Offset disabled the oscillator will always remain inside of the boundaries because the extremities will be updated instantly. When this feature is enabled it will update the boundaries one step behind instead of updating it instantly. This allows the user to more easily see overbought and oversold conditions at the cost of incurring a single bar lag to the boundaries. Generally this is a good idea as this behavior makes the oscillator more sensitive to recent price spikes or drops, reflecting sudden market movements more accurately. It accentuates the extremities of the market conditions, potentially offering a more aggressive analysis. The main trade-off with the Scale Offset feature is between sensitivity and potential overreaction. It offers a more immediate and exaggerated reflection of market conditions but might also lead to misinterpretations in certain scenarios, especially in highly volatile markets.
Divergence is used to predict potential trend reversals. It occurs when the price of an asset and the reading of an oscillator move in opposite directions. This discrepancy can signal a weakening of the current trend and possibly indicate a potential reversal.
Divergence doesn't always lead to a trend reversal, but it's a warning sign that the current trend might be weakening. Divergence can sometimes give false signals, particularly in strongly trending markets where the oscillator may remain in overbought or oversold conditions for extended periods. The lagging nature of using pivot points to calculate divergences means that all divergences are limited by the pivot look forward input. The upside of using a longer look forward is that the divergences will be more accurate. The obvious con here is that it will be more delayed and might be useless by the time it appears. Its recommended to use the built in divergences as a way to learn how these are formed so you can make your own in real time.
By default, the oscillator uses a smoothing of 3 to allow for a more price like behavior while still being rather smooth compared to raw price data. Conversely, you can increase this value to make this indicator behave smoother. Something to keep in mind is that the amount of delay from real time is equal to half of the smoothing period.
We have included a verity of alerts in this indicator. Here is a list of all of the available alerts: Bullish BOS, Bearish BOS, Bullish CHoCH, Bearish CHoCH, Bullish Divergence, Hidden Bullish Divergence, Bearish Divergence, Hidden Bearish Divergence, Cross Over Average, Cross Under Average.
Below are all of the inputs and their tooltips to get you started:
Settings:
Smoothing: Specifies the degree of smoothing applied to the oscillator. Higher values result in smoother but potentially less responsive signals.
Average Length: Sets the length of the moving average applied to the oscillator, affecting its sensitivity and smoothness.
Pivot Length: Specifies the forward-looking length for pivot points, affecting how the oscillator anticipates future price movements. This directly impacts the delay in finding a pivot.
Max Length: Sets the maximum length to consider for calculating the highest values in the oscillator.
Min Length: Defines the minimum length for calculating the lowest values in the oscillator.
Quick Update: Activates a faster update mode for the oscillator's extremities, which may result in less stable range boundaries.
Scale Offset: When enabled, delays updating minimum and maximum values to enhance signal directionality, allowing the signal to occasionally exceed normal bounds.
Candle Color: Enables coloring of candles based on the current directional signal of the oscillator.
Labels:
Enable BOS/CHoCH Labels: Activates the display of BOS (Break of Structure) and CHoCH (Change of Character) labels on the chart.
Visual Padding: Turns on additional visual padding at the top and bottom of the chart to accommodate labels. Determines the amount of visual padding added to the chart for label display.
Divergence:
Divergence Pivot: Defines the number of bars to the right of the pivot in divergence calculations, influencing the oscillator's responsiveness.
Divergence Pivot Forward: Directly impacts latency. Longer periods results in more accurate results at the sacrifice of delay.
Upper Range: Sets the upper range limit for divergence calculations, influencing the oscillator's sensitivity to larger trends.
Lower Range: Determines the lower range limit for divergence calculations, affecting the oscillator's sensitivity to shorter trends.
Symbol: Allows selection of the label style for divergence indicators, with options for text or symbolic representation.
Regular Bullish: Activates the detection and marking of regular bullish divergences in the oscillator.
Hidden Bullish: Enables the identification and display of hidden bullish divergences.
Regular Bearish: Turns on the feature to detect and highlight regular bearish divergences.
Hidden Bearish: Activates the functionality for detecting and displaying hidden bearish divergences.
Color:
Bullish: Determines the minimum/maximum color gradient for bullish signals, impacting the chart's visual appearance.
Bearish: Defines the minimum/maximum color gradient for bearish signals, affecting their visual representation.
Average: Specifies the color for the average line of the oscillator, enhancing chart readability.
CHoCH: Sets the color for bullish/bearish CHoCH (Change of Character) signals.
Premium/Discount: Determines the color for the premium/discount zone in the oscillator's visual representation.
Text Color: Sets the color for the text in BoS/CHoCH labels.
Regular Bullish: Defines the color used to represent regular bullish divergences.
Hidden Bullish: Specifies the color for hidden bullish divergences.
Regular Bearish: Determines the color for hidden bearish divergences.
Divergence Text Color: Specifies the color for the text in divergence labels.

Smart Money Concepts (SMC) [LuxAlgo]This all-in-one indicator displays real-time market structure (internal & swing BOS / CHoCH), order blocks, premium & discount zones, equal highs & lows, and much more...allowing traders to automatically mark up their charts with widely used price action methodologies. Following the release of our Fair Value Gap script, we received numerous requests from our community to release more features in the same category.
"Smart Money Concepts" (SMC) is a fairly new yet widely used term amongst price action traders looking to more accurately navigate liquidity & find more optimal points of interest in the market. Trying to determine where institutional market participants have orders placed (buy or sell side liquidity) can be a very reasonable approach to finding more practical entries & exits based on price action.
The indicator includes alerts for the presence of swing structures and many other relevant conditions.
Features
This indicator includes many features relevant to SMC, these are highlighted below:
Full internal & swing market structure labeling in real-time
Break of Structure (BOS)
Change of Character (CHoCH)
Order Blocks (bullish & bearish)
Equal Highs & Lows
Fair Value Gap Detection
Previous Highs & Lows
Premium & Discount Zones as a range
Options to style the indicator to more easily display these concepts
Settings
Mode: Allows the user to select Historical (default) or Present, which displays only recent data on the chart.
Style: Allows the user to select different styling for the entire indicator between Colored (default) and Monochrome.
Color Candles: Plots candles based on the internal & swing structures from within the indicator on the chart.
Internal Structure: Displays the internal structure labels & dashed lines to represent them. (BOS & CHoCH).
Confluence Filter: Filter non-significant internal structure breakouts.
Swing Structure: Displays the swing structure labels & solid lines on the chart (larger BOS & CHoCH labels).
Swing Points: Displays swing points labels on chart such as HH, HL, LH, LL.
Internal Order Blocks: Enables Internal Order Blocks & allows the user to select how many most recent Internal Order Blocks appear on the chart.
Swing Order Blocks: Enables Swing Order Blocks & allows the user to select how many most recent Swing Order Blocks appear on the chart.
Equal Highs & Lows: Displays EQH/EQL labels on chart for detecting equal highs & lows.
Bars Confirmation: Allows the user to select how many bars are needed to confirm an EQH/EQL symbol on chart.
Fair Value Gaps: Displays boxes to highlight imbalance areas on the chart.
Auto Threshold: Filter out non-significant fair value gaps.
Timeframe: Allows the user to select the timeframe for the Fair Value Gap detection.
Extend FVG: Allows the user to choose how many bars to extend the Fair Value Gap boxes on the chart.
Highs & Lows MTF: Allows the user to display previous highs & lows from daily, weekly, & monthly timeframes as significant levels.
Premium/Discount Zones: Allows the user to display Premium, Discount, and Equilibrium zones on the chart
Usage
Users can see automatic CHoCH and BOS labels to highlight breakouts of market structure, which allows to determine the market trend. In the chart below we can see the internal structure which displays more frequent labels within larger structures. We can also see equal highs & lows (EQH/EQL) labels plotted alongside the internal structure to frequently give indications of potential reversals.
In the chart below we can see the swing market structure labels. These are also labeled as BOS and CHoCH but with a solid line & larger text to show larger market structure breakouts & trend reversals. Users can be mindful of these larger structure labels while trading internal structures as displayed in the previous chart.
Order blocks highlight areas where institutional market participants open positions, one can use order blocks to determine confirmation entries or potential targets as we can expect there is a large amount of liquidity at these order blocks. In the chart below we can see 2 potential trade setups with confirmation entries. The path outlined in red would be a potential short entry targeting the blue order block below, and the path outlined in green would be a potential long entry, targeting the red order blocks above.
As we can see in the chart below, the bullish confirmation entry played out in this scenario with the green path outlined in hindsight. As price breaks though the order blocks above, the indicator will consider them mitigated causing them to disappear, and as per the logic of these order blocks they will always display 5 (by default) on the chart so we can now see more actionable levels.
The Smart Money Concepts indicator has many other features and here we can see how they can also help a user find potential levels for price action trading. In the screenshot below we can see a trade setup using the Previous Monthly High, Strong High, and a Swing Order Block as a stop loss. Accompanied by the Premium from the Discount/Premium zones feature being used as a potential entry. A potential take profit level for this trade setup that a user could easily identify would be the 50% mark labeled with the Fair Value Gap & the Equilibrium all displayed automatically by the indicator.
Conclusion
This indicator highlights all relevant components of Smart Money Concepts which can be a very useful interpretation of market structure, liquidity, & more simply put, price action. The term was coined & popularized primarily within the forex community & by ICT while making its way to become a part of many traders' analysis. These concepts, with or without this indicator do not guarantee a trader to be trading within the presence of institutional or "bank-level" liquidity, there is no supporting data regarding the validity of these teachings.

Smart Money Concept Change of Character Break of StructureSMC Structure
Visualizes Change of Character (CHoCH) and Break of Structure (BoS) - two fundamental Smart Money Concepts for identifying trend reversals and continuations.
This is the 1st version of an implementation of this concept.
It is NOT supposed to be used as a signal but a confirmation. Best use during NYSE hours.
Full Description
Overview
This indicator automatically detects and displays two core Smart Money Concepts (SMC) directly on your chart:
CHoCH (Change of Character) – The first structural break against the prevailing trend, signaling a potential reversal
BoS (Break of Structure) – A structural break in the direction of the current trend, confirming continuation
These concepts are essential building blocks of SMC trading methodology, helping traders identify where institutional players may be entering or exiting positions.
How It Works
The indicator uses pivot-based swing detection to identify significant highs and lows. When price breaks through these levels, it classifies the move as either a CHoCH or BoS based on the current trend context.
CHoCH (Change of Character)
Occurs when price breaks structure AGAINST the current trend
First warning sign that the trend may be reversing
Displayed as a solid horizontal line with "CHoCH" label
Green = Bullish reversal | Red = Bearish reversal
BoS (Break of Structure)
Occurs when price breaks structure IN THE DIRECTION of the current trend
Confirms that the existing trend remains intact
Displayed as a dashed horizontal line with "BoS" label
Teal = Bullish continuation | Maroon = Bearish continuation
Visual Example
Uptrend with BoS (continuation):
HH ◄── BoS (trend continues)
/
HL
/
HH
/
HL
Uptrend → CHoCH → Downtrend (reversal):
HH
/ \
HL \
LL ◄── CHoCH (trend reversal!)
Settings
Pivot Settings
Pivot Lookback: Number of bars used to identify swing highs/lows (default: 5). Higher values = fewer but more significant structure points.
Display Options
Show CHoCH: Toggle CHoCH visualization
Show BoS: Toggle BoS visualization
Show Swing Points: Display SH/SL labels at detected pivots
Extend Lines to Right: Extend structure lines into future bars
Show Info Table: Display current trend and last swing levels
Show Trend Background: Color the chart background based on trend direction
Colors
Fully customizable colors for all elements
How to Use
Identify the trend: Look at the sequence of CHoCH and BoS signals to understand market structure
Watch for CHoCH: A CHoCH signals potential reversal – wait for confirmation before trading against the previous trend
Trade with BoS: BoS confirms trend continuation – look for entries on pullbacks in the direction of the trend
Combine with other SMC concepts: Works great alongside Order Blocks, Fair Value Gaps, and liquidity concepts
Tips
Use higher pivot lookback values on higher timeframes for cleaner signals
A CHoCH doesn't guarantee reversal – it's the first warning sign, not confirmation
Multiple BoS signals in a row indicate a strong, healthy trend
Look for CHoCH occurring at key levels (support/resistance, order blocks) for higher probability setups
Feedback Welcome!
This is an open-source indicator and I'd love to hear your thoughts!
Please comment below if you have:
Feature requests or ideas for improvements
Bug reports or issues
Suggestions for additional SMC concepts to add
Your feedback helps make this indicator better for everyone. Happy trading! 🚀

Smart Money Support/Resistance - LiteSmart Money Support/Resistance — Lite
Overview & Methodology
This indicator identifies support and resistance as zones derived from concentrated buying and selling pressure, rather than relying solely on traditional swing highs/lows. Its design focuses on transparency: how data is sourced, how zones are computed, and how the on‑chart display should be interpreted.
Lower‑Timeframe (LTF) Data
The script requests Up Volume, Down Volume, and Volume Delta from a lower timeframe to expose intrabar order‑flow structure that the chart’s native timeframe cannot show. In practical terms, this lets you see where buyers or sellers briefly dominated inside the body of a higher‑timeframe bar.
bool use_custom_tf_input = input.bool(true, title="Use custom lower timeframe", tooltip="Override the automatically chosen lower timeframe for volume calculations.", group=grpVolume)
string custom_tf_input = input. Timeframe("1", title="Lower timeframe", tooltip="Lower timeframe used for up/down volume calculations (default 5 seconds).", group=grpVolume)
import TradingView/ta/10 as tvta
resolve_lower_tf(useCustom, customTF) =>
useCustom ? customTF :
timeframe.isseconds ? "1S" :
timeframe.isintraday ? "1" :
timeframe.isdaily ? "5" : "60"
get_up_down_volume(lowerTf) =>
= tvta.requestUpAndDownVolume(lowerTf)
var float upVolume = na
var float downVolume = na
var float deltaVolume = na
string lower_tf = resolve_lower_tf(use_custom_tf_input, custom_tf_input)
= get_up_down_volume(lower_tf)
upVolume := u_tmp
downVolume := d_tmp
deltaVolume := dl_tmp
• Data source: TradingView’s ta.requestUpAndDownVolume(lowerTf) via the official TA library.
• Plan capabilities: higher‑tier subscriptions unlock seconds‑based charts and allow more historical bars per chart. This expands both the temporal depth of LTF data and the precision of short‑horizon analysis, while base tiers provide minute‑level data suitable for day/short‑swing studies.
• Coverage clarity: a small on‑chart Coverage Panel reports the active lower timeframe, the number of bars covered, and the latest computed support/resistance ranges so you always know the bounds of valid LTF input.
Core Method
1) Data acquisition (LTF)
The script retrieves three series from the chosen lower timeframe:
– Up Volume (buyers)
– Down Volume (sellers)
– Delta (Up – Down)
2) Rolling window & extrema
Over a user‑defined lookback (Global Volume Period), the algorithm builds rolling arrays of completed bars and scans for extrema:
– Buyers_max / Buyers_min from Up Volume
– Sellers_max / Sellers_min from Down Volume
Only completed bars are considered; the current bar is excluded for stability.
3) Price mapping
The extrema are mapped back to their source candles to obtain price bounds:
– For “maximum” roles the algorithm uses the relevant candle highs.
– For “minimum” roles it uses the relevant candle lows.
These pairs define candidate resistance (max‑based) and support (min‑based) zones or vice versa.
4) Zone construction & minimum width
To ensure practicality on all symbols, zones enforce a minimum vertical thickness of two ticks. This prevents visually invisible or overly thin ranges on instruments with tight ticks.
5) Vertical role resolution
When both max‑ and min‑based zones exist, the script compares their midpoints. If, due to local price structure, the min‑based zone sits above the max‑based zone, display roles are swapped so the higher zone is labeled Resistance and the lower zone Support. Colors/widths are updated accordingly to keep the visual legend consistent.
6) Rendering & panel
Two horizontal lines and a filled box represent each active zone. The Coverage Panel (bottom‑right by default) prints:
– Lower‑timeframe in use
– Number of bars covered by LTF data
– Current Support and Resistance ranges
If the two zones overlap, an additional “Range Market” note is shown.
Key Inputs
• Global Volume Period: shared lookback window for the extrema search.
• Lower timeframe: user‑selectable override of the automatically resolved lower timeframe.
• Visualization toggles: independent show/hide controls and colors for maximum (resistance) and minimum (support) zones.
• Coverage Panel: enable/disable the single‑cell table and its readout.
Operational Notes
• The algorithm aligns all lookups to completed bars (no peeking). Price references are shifted appropriately to avoid using the still‑forming bar in calculations.
• Second‑based lower timeframes improve granularity for scalping and very short‑term entries. Minute‑based lower timeframes provide broader coverage for intraday and short‑swing contexts.
• Use the Coverage Panel to confirm the true extent of available LTF history on your symbol/plan before drawing conclusions from very deep lookbacks.
Visual Walkthrough
A step‑by‑step image sequence accompanies this description. Each figure demonstrates how the indicator reads LTF volume, locates extrema, builds price‑mapped zones, and updates labels/colors when vertical order requires it.
Chart Interpretation
This chart illustrates two distinct perspectives of the Smart Money Support/Resistance — Lite indicator, each derived from different lookback horizons and lower-timeframe (LTF) resolutions.
1- Short-term view (43 bars, 10-second LTF)
Using the most recent 43 completed bars with 10-second intrabar data, the algorithm detects that both maximum and minimum volume extrema fall within a narrow range. The result is a clearly identified range market: resistance between 178.15–184.55 and support between 175.02–179.38.
The Coverage Panel (bottom-right) confirms the scope of valid input: the lower timeframe used, number of bars covered, and the resulting zones. This short-term scan highlights how the indicator adapts to limited data depth, flagging sideways structure where neither side dominates.
2 - Long-term view (120 bars, 30-second LTF)
Over a wider 120-bar lookback with higher-granularity 30-second data, broader supply and demand zones emerge.
– The long-term resistance zone captures the concentration of buyers and sellers at the upper boundary of recent price history.
– The long-term support zone anchors to the opposite side of the distribution, derived from maxima and minima of both buying and selling pressure.
These zones reflect deeper structural levels where market participants previously committed significant volume.
Combined Perspective
By aligning the short-term and long-term outputs, the chart shows how the indicator distinguishes immediate consolidation (range market) from more durable support and resistance levels derived from extended history. This dual resolution approach makes clear that support and resistance are not static lines but dynamic zones, dependent on both timeframe depth and the resolution of intrabar volume data.

Smart Money Flow Index (SMFI) - This tool is useful for comparing price action with underlying money flow and spotting where smart money may be entering or exiting the market.

Smart Money Breakout Channels [AlgoAlpha]🟠 OVERVIEW
This script draws breakout detection zones called “Smart Money Breakout Channels” based on volatility-normalized price movement and visualizes them as dynamic boxes with volume overlays. It identifies temporary accumulation or distribution ranges using a custom normalized volatility metric and tracks when price breaks out of those zones—either upward or downward. Each channel represents a structured range where smart money may be active, helping traders anticipate key breakouts with added context from volume delta, up/down volume, and a visual gradient gauge for momentum bias.
🟠 CONCEPTS
The script calculates normalized price volatility by measuring the standard deviation of price mapped to a scale using the highest and lowest prices over a set lookback period. When normalized volatility reaches a local low and flips upward, a boxed channel is drawn between the highest and lowest prices in that zone. These boxes persist until price breaks out, either with a strong candle close (configurable) or by touching the boundary. Volume analysis enhances interpretation by rendering delta bars inside the box, showing volume distribution during the channel. Additionally, a real-time visual “gauge” shows where volume delta sits within the channel range, helping users spot pressure imbalances.
🟠 FEATURES
Automatic detection and drawing of breakout channels based on volatility-normalized price pivots.
Optional nested channels to allow multiple simultaneous zones or a clean single-zone view.
Gradient-filled volume gauge with dynamic pointer to show current delta pressure within the box.
Three volume visualization modes: raw volume, comparative up/down volume, and delta.
Alerts for new channel creation and confirmed bullish or bearish breakouts.
🟠 USAGE
Apply the indicator to any chart. Wait for a new breakout box to form—this occurs when volatility behavior shifts and a stable range emerges. Once a box appears, monitor price relative to its boundaries. A breakout above suggests bullish continuation, below suggests bearish continuation; signals are stronger when “Strong Closes Only” is enabled.
Watch the internal volume candles to understand where buy/sell pressure is concentrated during the box. Use the gauge on the right to interpret whether net pressure is building upward or downward before breakout to anticipate the direction.
Use alerts to catch breakout events without needing to monitor the chart constantly 🚨.

Smart Money Breakout Signals [AlgoAlpha]Introducing the Smart Money Breakout Signals, a cutting-edge trading indicator designed to identify key structural shifts and breakout opportunities in the market. This tool leverages a blend of smart money concepts like Break of Structure (BOS) and Change of Character (CHoCH) to provide traders with actionable insights into market direction and potential entry or exit points.
Key Features :
✨ Market Structure Analysis : Automatically detects and labels BOS and CHoCH for trend confirmation and reversals.
🎨 Customizable Visualization : Tailor bullish and bearish colors for breakout lines and signals to suit your preferences.
📊 Dynamic Take-Profit Targets : Displays three tiered take-profit levels based on breakout volatility.
🔔 Real-Time Alerts : Stay ahead of the game with notifications for bullish and bearish breakouts.
📋 Performance Dashboard : Monitor signal statistics, including win rates and total signals, directly on your chart.
How to Use :
Add the Indicator : Add the script to your favourites ⭐ and customize settings like market structure horizon and confirmation type.
Monitor Breakouts : Observe BOS and CHoCH labels to identify potential trend shifts. Use the breakout lines and tiered take-profit levels to plan trades effectively.
Set Alerts : Enable alerts for bullish or bearish breakouts to act on opportunities without constant monitoring.
How It Works :
The indicator identifies market structure by analyzing pivot highs and lows over a user-defined time horizon. A breakout is confirmed based on either candle closes or wicks surpassing previous pivot points. Upon detection, the script generates signals with breakout lines and calculates take-profit targets based on the distance from the breakout level. A built-in dashboard tracks performance metrics like total signals and win rates, giving traders real-time feedback on strategy effectiveness.

Smart Money Analysis with Golden/Death Cross [YourTradingSensei]Description of the script "Smart Money Analysis with Golden/Death Cross":
This TradingView script is designed for market analysis based on the concept of "Smart Money" and includes the detection of Golden Cross and Death Cross signals.
Key features of the script:
Moving Averages (SMA):
Two moving averages are calculated: a short-term (50 periods) and a long-term (200 periods).
The intersections of these moving averages are used to determine Golden Cross and Death Cross signals.
High Volume:
The current trading volume is analyzed.
Periods of high volume are identified when the current volume exceeds the average volume by a specified multiplier.
Support and Resistance Levels:
Key support and resistance levels are determined based on the highest and lowest prices over a specified period.
Buy and Sell Signals:
Buy and sell signals are generated based on moving average crossovers, high volume, and the closing price relative to key levels.
Golden Cross and Death Cross:
A Golden Cross occurs when the short-term moving average crosses above the long-term moving average.
A Death Cross occurs when the short-term moving average crosses below the long-term moving average.
These signals are displayed on the chart with text color changes for better visualization.
Using the script:
The script helps traders visualize key signals and levels, aiding in making informed trading decisions based on the behavior of major market players and technical analysis.
Custom candle lighting(CCL) © 2024 by YourTradingSensei is licensed under CC BY-NC-SA 4.0. To view a copy of this license.

Smart Money Setup 03 [TradingFinder] Minor OB & Trend Proof🔵 Introduction
The "Smart Money Concept" transcends mere technical trading strategies; it embodies a comprehensive philosophy elucidating market dynamics. Central to this concept is the acknowledgment that influential market participants manipulate price actions, presenting challenges for retail traders.
As a "retail trader", aligning your strategy with the behavior of "Smart Money," primarily market makers, is paramount. Understanding their trading patterns, which revolve around supply, demand, and market structure, forms the cornerstone of your approach. Consequently, decisions to enter trades should be informed by these considerations.
🟣 Important Note
In this setup, pattern formation revolves around the robustness of the "Stop Hunt" targeting retail traders.
When this stop hunt occurs, if the price tests below the minor pivot or above the minor pivot, a "Minor Order Block" is formed.
Similarly, if the price tests below the major pivot or above the major pivot, a "Major Order Block" is formed.
Since the price hasn't successfully broken the major pivots before breaking the Top or Bottom, it can be inferred that the minor pivots formed within a leg of price movement exhibit a "Range" structure.
For a deeper comprehension of this setup, refer to the accompanying visual aids below.
Bullish Setup Details :
Bearish Setup Details :
🔵 How to Use
Upon integrating the indicator into your chart, exercise patience as you await the evolution of the trading setup.
Experiment with different trading positions by adjusting both the "Time Frame" and "Pivot Period". Typically, setups materializing over longer "Time Frames" and "Pivot Periods" carry heightened validity.
Bullish Setup Details on Chart :
Bearish Setup Details on Chart :
Within the settings, you possess the flexibility to modify the "Pivot Period" input to tailor the indicator to your preferences.

Smart Money Setup 02 [TradingFinder] Mitigated Major OB Proof🔵 Introduction
"Smart money" is money invested by knowledgeable individuals at the right time, and this investment can yield the highest returns.
The concept we focus on in this indicator is whether the market is in an uptrend or downtrend. The market briefly takes a weak and reversal trend with "Minor BoS" without being able to break the major pivot.
In the next step, it returns to its main trend with a strong bullish move and continues its trend with a "Major BoS". The "order block" behind this rapid and powerful movement can be a valid order block for trading.
To better understand this setup, please refer to the explanations in the two images below.
Bullish Setup Details :
Bearish Setup Details :
🔵 How to Use
After adding the indicator to the chart, you should wait for trading opportunities to form. By changing the "Time Frame" and "Period Pivot", you can see different trading positions. In general, the lower the "Time Frame" and "Period Pivot", the higher the likelihood of forming trading opportunities.
Bullish Setup Details on Chart :
Bearish Setup Details on Chart :
You can access "Period Pivot" via settings as an input.

Smart Money Breakouts [ChartPrime]The " Smart Money Breakouts " indicator is designed to identify breakouts based on changes in character (CHOCH) or breaks of structure (BOS) patterns, facilitating automated trading with user-defined Take Profit (TP) level.
the indicator incorporates essential elements such as volume analysis and a data table to assist traders in optimizing their strategies.
🔸 Breakout Detection:
The indicator scans price movements for "Change in Character" (CHOCH) and "Break of Structure" (BOS) patterns, signaling potential breakout opportunities in the market.
🔸User-Defined TP :
Traders can customize the Take Profit (TP) through the indicator settings, with these levels dynamically calculated based on the Average True Range (ATR). This allows for precise risk management and profit targets that adapt to market volatility.
🔸 Volume Analysis and Trade Direction Specific Analysis:
The indicator includes a volume checker that provides valuable insights into the strength of the breakout, taking into account trade direction.
🔸If the volume label is red and the trade is long, it suggests a higher likelihood of hitting the Stop Loss (SL).
🔸If the volume label is green and the trade is long, it indicates a higher probability of hitting the Take Profit (TP).
🔸For short trades, a red volume label suggests a higher likelihood of hitting TP, while a green label suggests a higher likelihood of hitting SL.
🔸A yellow volume label suggests that the volume is inconclusive, neither favoring bullish nor bearish movements.
🔸Data Table:
The indicator features a data table that keeps track of the number of winning and losing trades for specific timeframes or configurations.
This table serves as a valuable tool for traders to analyze performance and discover optimal settings and timeframes.
The "Smart Money Breakouts" indicator provides traders with a comprehensive solution for breakout trading, combining technical analysis of changes in character and breaks of structure, volume insights, and performance tracking while dynamically adjusting TP and SL levels based on market volatility through the ATR.

Smart Money Concept, Modern ViewSmart Money Concept, Modern View (SMCMV)
Institutional Volume Flow Analysis with VWMA Matrix
━━━━━━━━━━━━━━━━━━━━━━━━━━━━━━━━━━━━━━━━━━━━━━━━━━
📌 OVERVIEW
SMCMV is an advanced institutional-grade indicator that combines Volume-Weighted Moving Average (VWMA) matrix analysis with sophisticated volume decomposition to detect buyer and seller entry points. The indicator provides a comprehensive real-time dashboard displaying market structure, volume dynamics, and validated trading signals.
Key Features:
• Dual Volume Model: Geometry-based (candle range split) and Intrabar (precise LTF data)
• 10-Period VWMA Spectrum: Multi-timeframe support/resistance matrix (7, 13, 19, 23, 31, 41, 47, 67, 83, 97)
• 5-Layer Scoring System: 100-point institutional-grade signal quality assessment
• State Machine Signal Engine: Validated entry/exit signals with timer and range confirmation
• Real-time Prediction Engine: Candle-by-candle buyer/seller probability estimation
• High Volume Node Detection: Automatic identification of significant volume zones
━━━━━━━━━━━━━━━━━━━━━━━━━━━━━━━━━━━━━━━━━━━━━━━━━━
📊 DASHBOARD REFERENCE
1) NOW VECTOR (Current Market State)
This section captures the immediate market conditions:
• FLOW ANGLE: Directional angle of price movement in degrees (from VWMA-5). Positive = bullish, Negative = bearish.
• LTP: Last Traded Price - current close price.
• NET FLOW (Δ): Volume Delta - net difference between buying and selling volume. Shows ⚡+ or ⚡-.
• LIQUIDITY: Total volume on the current bar (K/M format).
• BUY VOL: Estimated buying volume based on selected model.
• SELL VOL: Estimated selling volume.
• BID PRES.: Buying volume as percentage of total volume.
• ASK PRES.: Selling volume as percentage of total volume.
• DIRECTION: Current state with hysteresis: BULL (🐂), BEAR (🐻), or NEUT (⚪).
2) DATA QUALITY / CONFIG
Configuration status and data integrity monitoring:
• VOL MODEL: INTRABAR (uses LTF data) or GEOMETRY (estimates from candle structure).
• IB LTF: Intrabar Lower Timeframe for precise volume decomposition.
• MODE: Micro (7 periods: 7-47) or Macro (10 periods: 7-97).
• IB OK: Intrabar data validity - OK or NO.
• IB STREAK: Consecutive bars with valid intrabar data.
• LATENCY: Data freshness indicator. ✓ = current, ↺ = using historical reference.
3) STRUCTURE RADAR
Market structure analysis showing price position relative to VWMA matrix:
• WIRES ▲/▼: Count of VWMAs above (resistance) and below (support).
• RES: Nearest Resistance - shows MA period, "ZN RES", or "BLUE SKY".
• SUPP: Nearest Support - shows MA period, "ZN SUPP", or "FREE FALL".
4) ACTIVE INTERACTION
Real-time analysis of price interaction with key levels:
• Header Status: "⚠ TESTING SUPPLY (ASK SIDE)" / "⚠ TESTING DEMAND (BID SIDE)" / "--- NO KEY INTERACTION ---"
• TARGET: Active level being tested (MA period or zone type).
• TEST LEVEL: Exact price level being tested.
• SCORE: Total score (0-100%) with letter grade .
• VOLUME POWER: Volume ratio vs historical average (e.g., "2.5x").
• BREAKOUT: "CONFIRMED" if attacking volume exceeds defending, "REJECTED" otherwise.
• DELTA DIR: "ALIGNED" if delta matches accumulation trend, "CONFLICT" if opposing.
━━━━━━━━━━━━━━━━━━━━━━━━━━━━━━━━━━━━━━━━━━━━━━━━━━
🎯 5-LAYER SCORING SYSTEM (100 Points Total)
Layer 1: Volume Quality (Max 25 pts)
• Mass (0-10): Volume ratio vs average. 0.5x=0, 1.0x=5, 2.0x=8, 3.0x+=10
• Spike (0-8): Volume Z-Score intensity
• Trend (0-7): Volume trend alignment with price direction
Layer 2: Battle Structure (Max 25 pts)
• Break (0-10): Breakout intensity ratio (attacker vs defender)
• Dom (0-8): Internal dominance ratio
• Pres (0-7): Pressure imbalance percentage
Layer 3: Flow & Energy (Max 20 pts)
• Delta (0-8): Delta alignment with accumulation trend
• Accel (0-6): Delta acceleration
• Mom (0-6): Flow momentum
Layer 4: Geometry (Max 15 pts)
• Impact (0-7): Impact angle directness
• Vec (0-5): Vector alignment
• PriceZ (0-3): Price Z-Score position
Layer 5: Army Structure (Max 15 pts)
• Stack (0-5): MA stack depth
• Conf (0-5): Confluence percentage
• Trend (0-5): Trend alignment count (7>13, 13>23, 23>97)
Grade Scale:
• A+ = 90-100 pts (Exceptional)
• A = 80-89 pts (Strong)
• B+ = 70-79 pts (Good)
• B = 60-69 pts (Moderate)
• C+ = 50-59 pts (Below average)
• C/D/F = Below 50 pts (Weak)
━━━━━━━━━━━━━━━━━━━━━━━━━━━━━━━━━━━━━━━━━━━━━━━━━━
5) SIGNAL STATUS PANEL
Real-time signal state machine status:
• Header: "🐂 BUYERS ACTIVE" / "🐻 SELLERS ACTIVE" / "⏳ VALIDATING..." / "⏸ RANGE / FLAT"
• LOCK PRICE: Price at which signal was locked/confirmed.
• RANGE ±: Validation range percentage.
• POSITION: Price vs lock: "▲ ABOVE" / "▼ BELOW" / "● AT LOCK"
• DISTANCE: Percentage distance from lock price.
• vs RANGE: Position vs validation range: "IN_RANGE" / "ABOVE" / "BELOW"
• VAL TICKS: Validation progress (current/required ticks).
6) REALTIME PREDICTION PANEL
Candle prediction engine:
• WINNER: Predicted dominant side: "BUYERS" / "SELLERS" / "NEUTRAL"
• CONFIDENCE: Prediction confidence percentage.
• ACCURACY: Historical prediction accuracy (session-specific).
• BUY/SELL PROB: Individual probabilities for each side.
━━━━━━━━━━━━━━━━━━━━━━━━━━━━━━━━━━━━━━━━━━━━━━━━━━
🏷️ SIGNAL LABELS REFERENCE
• 🐂 BUYER ENTRY (Green): Confirmed buyer entry signal. Validation complete.
• 🐻 SELLER ENTRY (Red): Confirmed seller entry signal. Validation complete.
• 🔻 REVERSAL BUY→SELL (Magenta): Reversal from buyer to seller position.
• 🔺 REVERSAL SELL→BUY (Cyan): Reversal from seller to buyer position.
• ⏹ EXIT → FLAT (Gray): Position exit to flat/neutral state.
• ⬆ BUYER STRONGER (Small Green): Lock price updated higher during buyer state.
• ⬇ SELLER STRONGER (Small Red): Lock price updated lower during seller state.
Display Modes:
• Minimal: Icon only (hover for tooltip details)
• Normal: Icon + Price level
• Detailed: Full information (price, score, grade)
━━━━━━━━━━━━━━━━━━━━━━━━━━━━━━━━━━━━━━━━━━━━━━━━━━
📈 CHART ELEMENTS
VWMA Spectrum Lines
Colored gradient lines representing the 10-period VWMA matrix. Color progresses from light blue (fast: 7-period) through purple to orange (slow: 97-period). These act as dynamic support/resistance levels weighted by volume.
High Volume Node Lines
• Blue Lines: High Buy Volume zones - potential demand areas
• Red Lines: High Sell Volume zones - potential supply areas
• Yellow Lines: Overlapping zones (buy + sell extremes) - high conflict areas
Lock Price Line & Range Band
• Dashed Line: Locked price level (green for buyers, red for sellers)
• Dotted Lines: Upper/lower bounds of validation range
━━━━━━━━━━━━━━━━━━━━━━━━━━━━━━━━━━━━━━━━━━━━━━━━━━
⚙️ INPUT SETTINGS GUIDE
Volume Model
• Calculation Method: "Geometry (Candle-Range Split)" for universal compatibility or "Intrabar (Precise)" for accurate buy/sell separation.
• Intrabar LTF: Lower timeframe for Intrabar mode (e.g., "1" for 1-minute).
Direction Filter
• Direction Trigger Angle: Threshold for directional state change (default: 1.5°)
• Neutral Reset Angle: Threshold for returning to neutral (default: 0.7°)
Testing Filter
• Level Proximity (%): How close price must be to "test" a level (default: 0.25%)
• Require Wick Touch: If enabled, requires high/low to touch proximity band.
Signal Validation
• Lock Range (%): Price range for validation (default: 0.5%)
• Validation Ticks: Consecutive bars required (default: 3)
• Validation Time: Minimum seconds for real-time confirmation (default: 5)
• Minimum Hold Bars: Stay in position for at least this many bars (default: 5)
• Exit Mode: "Reversal Only" / "Signal Loss" / "Price Stop"
• Stop Loss (%): Exit threshold (default: 1.0%)
Signal Score Filter
• Score Range Minimum: Minimum score for signal generation (default: 10%)
• Score Range Maximum: Maximum score threshold (default: 100%)
━━━━━━━━━━━━━━━━━━━━━━━━━━━━━━━━━━━━━━━━━━━━━━━━━━
💡 USAGE RECOMMENDATIONS
1. Start with Macro mode to see the complete VWMA spectrum, then switch to Micro for cleaner charts.
2. Use Intrabar mode when your broker provides lower timeframe data.
3. Focus on high-grade signals (B+ or better) for higher probability setups.
4. Wait for validation to complete before acting on signals.
5. Use the Lock Price line as your reference for position management.
━━━━━━━━━━━━━━━━━━━━━━━━━━━━━━━━━━━━━━━━━━━━━━━━━━
⚠️ IMPORTANT NOTES
• This indicator is designed for educational and analytical purposes.
• Always combine with proper risk management and additional confirmation.
• Past performance and signal quality do not guarantee future results.
• The prediction accuracy is session-specific and resets on chart reload.
━━━━━━━━━━━━━━━━━━━━━━━━━━━━━━━━━━━━━━━━━━━━━━━━━━
Volume-Based Indicator — Data Granularity & Table Guide
1) Critical warning about data granularity (read first)
Important: This indicator is built entirely on volume-derived calculations (volume, volume delta, and related flow metrics). Because of that, its precision is only as good as the granularity and history of the data you feed it.
The most granular view is a tick-based interval (e.g., 1T = one trade/tick). If tick-based intervals are not available for your symbol or your plan, the closest time-based approximation is a 1-second chart (1S).
If you enable any "high-precision / intrabar" options (anything that relies on the smallest updates), make sure you understand which TradingView plan you are using, because intrabar historical depth (how many bars you can load) varies by plan. More history generally means more stable baselines for volume statistics, regime detection, and long lookback features.
Plan-related notes (TradingView)
TradingView limits how many intrabar historical bars can be loaded, depending on your plan. The exact limits are defined by TradingView and can change over time, but as of the current documentation, the intrabar limits are:
• Basic: 5,000 bars
• Essential: 10,000 bars
• Plus: 10,000 bars
• Premium: 20,000 bars
• Expert: 25,000 bars
• Ultimate: 40,000 bars
Tick charts / tick-based intervals are currently positioned as a feature of professional-tier plans (e.g., Expert/Elite/Ultimate). Availability may also vary by symbol and data feed.

Smart Money Concepts - Absorption Smart Money Concepts - Absorption (SMC-ABS)
Absorption event detector using split-volume VWMA ribbons, entropy filtering, and elasticity validation
Overview
This indicator highlights potential absorption/defense events: moments where price touches a volume-weighted band and then rejects, while additional filters confirm that market conditions are not random/noisy.
What it plots
• Energy ribbons (bands): two split-volume VWMA ribbon sets - Buy-weighted (cyan) and Sell-weighted (magma).
• ABS markers: printed when touch + rejection + validation conditions are met (see Logic section).
• Dashboard (HUD): real-time metrics such as price/volume z-scores, delta, entropy state, and resonance momentum states.
Core logic
1) Volume engine
The script builds Buy Volume and Sell Volume series using one of two modes:
• Geometry (candle-range split): estimates buy/sell participation from the close position within the candle range.
• Intrabar (precise): uses lower-timeframe up/down volume to derive buy/sell flows when data is available.
2) Split-VWMA resonance score
For multiple periods (5, 10, 20, 30, 40, 50), the script computes:
• A standard SMA of price.
• A Buy-weighted VWMA of price (weighted by Buy Volume).
• A Sell-weighted VWMA of price (weighted by Sell Volume).
Resonance is derived from the normalized divergence between the SMA and the split VWMAs, aggregated across the available periods.
3) Validation filters
Signals can be filtered by the following components (each toggleable):
• Volume-weighted entropy: a fractal-efficiency style disorder metric (TR-sum vs range) adjusted by relative volume; high entropy blocks signals.
• Momentum alignment (resonance velocity) : direction filter requiring positive velocity for buy events and negative velocity for sell events.
• Elasticity (recoil vs penetration): rejection quality check based on the bounce-back strength relative to the penetration depth into the fast band.
Absorption event conditions (ABS markers)
ABS markers are generated using the fastest ribbon band (length 5) for the touch/rejection logic:
• Buy absorption: low touches/penetrates the Buy band and the candle closes back above it, with filters passing.
• Sell absorption: high touches/penetrates the Sell band and the candle closes back below it, with filters passing.
Note: acceleration/deceleration is displayed in the HUD as a state; the primary directional filter is the resonance velocity.
Settings
• Volume Model: choose Geometry or Intrabar.
• Intrabar LTF: lower timeframe used by the Intrabar model (only applies when Intrabar is selected).
• Global Lookback: lookback window used for z-score statistics and related calculations.
• Quantum Filters: toggles and thresholds for entropy, momentum alignment, and elasticity validation.
• Dashboard Settings :/ Energy Ribbons / Absorption Events: controls for visuals and filtering behavior.
Usage notes and limitations
• Signals are most reliable after candle close. On the forming candle, conditions can change until the bar closes.
• Results depend on the availability and quality of volume data for the selected symbol and exchange.
• The Geometry mode is an estimate based on candle structure; it is not tick-accurate order flow.
• Terms such as “quantum” and “physics” are metaphorical labels for statistical filters and validation heuristics.
Disclaimer
This tool is provided for analytical and educational use only. It does not constitute investment advice. Trading involves risk.
Important note about Intrabar data and TradingView plan limits
This indicator is volume-dependent. When using the Intrabar model, the best results typically come from very low intrabar timeframes such as 1 tick or 1 second (if your symbol and data feed support it). Please check your TradingView subscription plan and data entitlements - access to 1-second/1-tick lower timeframes is commonly restricted to higher-tier plans (often referred to as Premium/Ultra tiers). If intrabar data is not available, the script falls back to relative buy/sell volume estimation (Geometry mode), and results may be less precise.


